Financial Summary 2021–2022
Over the past year, campus gradually returned to a more “normal” (i.e., pre-pandemic) level of activity, and, while the pandemic is not entirely behind us, most of the costs associated with the University’s response to it have moderated significantly. Unfortunately, ongoing inflationary pressures resulting from the pandemic and from other geopolitical factors continue to impact the budget, and the “Great Resignation” has impacted our workforce.
Despite these pressures, our operating results continue to be healthy and stable, driven by a strong brand and robust undergraduate enrollment, continued growth in the endowment, and discipline in managing expenses. Our continued healthy operations, combined with the generous support of our donors, facilitate significant continued investment in campus infrastructure and in the endowment. These institutional strengths were cited by Moody’s Investors Service in February 2022, when the University’s credit rating was raised to Aa3, with a stable outlook. In April, Standard and Poor’s affirmed our AA- credit rating and stable outlook.
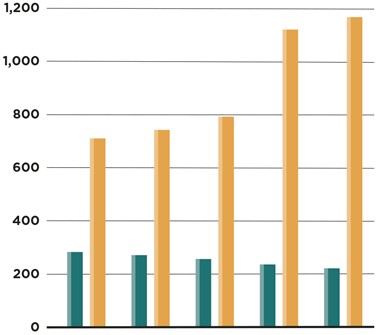
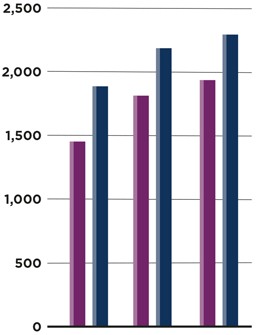
For the year ended May 31, 2022, total net assets increased by $125 million, to over $1.9 billion, primarily as the result of fundraising, as well as income from operations. Despite volatility in the financial markets, the endowment recorded a net return of 4.0 percent for the fiscal year, which exceeded its performance benchmarks. The market value of the investment pool increased to $1.17 billion as of May 31, 2022, after providing support to operations of over $38 million, which represents over 7.5 percent of total operating expenses.
Ground was recently broken for the renovation and expansion of Drosdick Hall, which represents the first major facilities project associated with the University’s Strategic Plan, Rooted. Restless. An updated master plan for campus facilities is currently being developed to identify future major projects.
Our positioning in the higher education marketplace, stable financial position and operations, and loyal and generous donors enable us to look forward with confidence as we prepare to move the campus into the future.
Sincerely,

Neil J. Horgan
Vice President for Finance and Chief Financial Officer
BALANCE SHEETS
($ in thousands) as of May 31
Table of Assets and Liabilities from 2020–2022
| 2022 | 2021 | 2020 | |
|---|---|---|---|
| ASSETS | |||
| Cash and Cash Equivalents | $ 83,020 | $ 98,461 | $ 133,194 |
| Investments | 1,359,040 | 1,262,769 | 909,782 |
| Accounts and Pledges Receivable, net | 88,604 | 67,661 | 80,317 |
| Other Assets | 30,394 | 31,779 | 15,583 |
| Land, Buildings and Equipment, net | 726,397 | 717,114 | 741,930 |
| TOTAL ASSETS | $2,287,455 | $2,177,784 | $1,880,806 |
| LIABILITIES | |||
| Accounts Payable and Accrued Expenses | $ 77,767 | $ 69,654 | $ 53,531 |
| Deposits and Deferred Revenue | 31,060 | 34,706 | 40,695 |
| Short-Term Lines of Credit | — | — | 60,000 |
| Long-Term Obligations | 219,262 | 236,822 | 254,044 |
| Other Liabilities | 30,555 | 32,711 | 23,834 |
| TOTAL LIABILITIES | 358,644 | 373,893 | 432,104 |
| NET ASSETS | 1,928,811 |
1,803,891 | 1,448,702 |
| TOTAL LIABILITIES AND NET ASSETS | $2,287,455 | $2,177,784 | $1,880,806 |
Endowment vs. Long-Term Debt
($ in millions)

Table of Endowment vs. Long-Term Debt
| 2018 | 2019 | 2020 | 2021 | 2022 | |
|---|---|---|---|---|---|
| Endowment ($) - gold | 711 | 743 | 797 | 1,123 | 1,166 |
| Long-Term Debt ($) - green | 282 | 268 | 254 | 237 | 219 |
Net Assets
($ in millions)

Table of Net Assets
| 2020 | 2021 | 2022 | |
|---|---|---|---|
| Total Assets ($) - blue | 1,881 | 2,178 | 2,287 |
| Total Net Assets ($) - purple | 1,449 | 1,804 | 1,929 |
UNRESTRICTED REVENUES
($ in thousands) as of May 31
Table of Operating Revenues from 2020-2022
| 2022 | 2021 | 2020 | |
|---|---|---|---|
| OPERATING REVENUES | |||
| Student-Related Revenue: | |||
| Student Tuition and Fees | $ 490,462 | $ 480,736 | $ 461,867 |
| Sales and Services of Auxiliary Enterprises | 92,575 | 75,392 | 71,079 |
| Less: Financial Assistance | (159,882) | (153,961) | (142,523) |
| $423,155 | $402,167 | $390,423 |
|
| Gifts and Grants | 29,570 | 27,596 | 25,230 |
| Endowment Resources | 38,150 | 35,527 | 32,171 |
| Investment Income | 3,400 | 2,234 | 4,004 |
| Other | 45,315 | 23,712 | 35,312 |
| TOTAL OPERATING REVENUES | $539,590 | $491,236 | $487,140 |
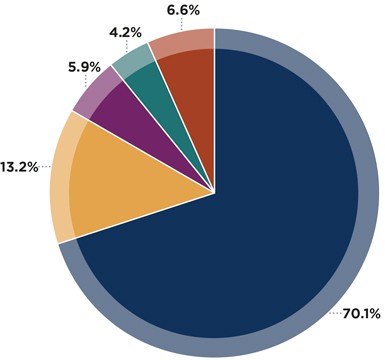
Sources of Operating Revenue (Gross) 2022

Table of Operating Revenue (Gross) Sources for 2022
| Tuition and Fees (blue) | 70.1% | $ 490,462 |
| Auxiliary Services (gold) | 13.2% | 92,595 |
| Investments (purple) | 5.9% | 41,550 |
| Gifts and Grants (green) | 4.2% | 29,570 |
| Other (orange) | 6.6% | 45,315 |
| $699,471 |
UNRESTRICTED EXPENSES
($ in thousands) as of May 31
Table of Operating Expenses from 2020-2022
| 2022 | 2021 | 2020 | |
|---|---|---|---|
| OPERATING EXPENSES | |||
| Salaries, Wages and Employee Benefits | $ 326,258 | $ 307,660 | $297,543 |
| Supplies, Services and Other | 126,292 | 101,911 | 112,058 |
| Depreciation | 38,299 | 37,361 | 33,070 |
| Interest on Indebtedness | 7,598 | 8,319 | 8,849 |
| Utilities | 8,623 | 6,300 | 6,659 |
| TOTAL OPERATING EXPENSES | $507,070 | $461,551 | $ 458,179 |
| AMOUNTS RESERVED FOR CAPITAL EXPENDITURES, DEBT PRINCIPAL PAYMENTS AND STRATEGIC INITIATIVES |
$32,520 | $29,685 | $28,961 |
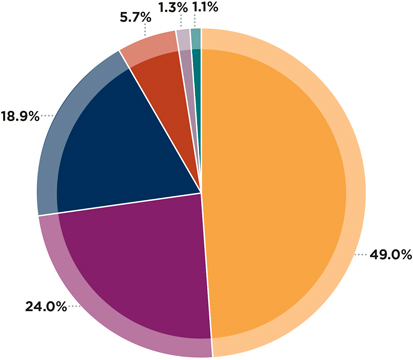
Distribution of Expenses and Contra-Revenue 2022

Table of Expenses and Contra-Revenue Distribution in 2022
| Salaries, Wages and Employee Benefits (gold) | 49.0% | $ 326,258 |
| Financial Assistance (purple) | 24.0% | 159,882 |
| Supplies, Services and Other (blue) | 18.9% | 126,292 |
| Depreciation (orange) | 5.7% | 38,299 |
| Utilities (light purple) | 1.3% | 8,623 |
| Interest on Indebtedness (green) | 1.1% | 7,598 |
| $666,952 |
