Villanova University Waste & Recycling Data
Since the introduction of Villanova University's Recycling Program in 1990, 107,265,603 total pounds of material has been recycled through our program
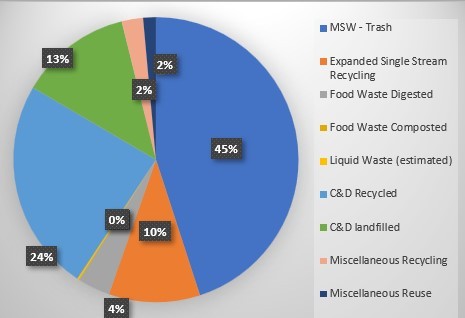
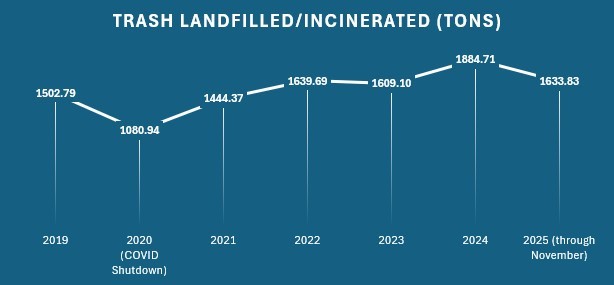
The data listed below shows a breakdown of our waste/recycling totals from 2020-2024. Waste generation, especially trash volume, was lower in 2020 due to the impacts of COVID 19.
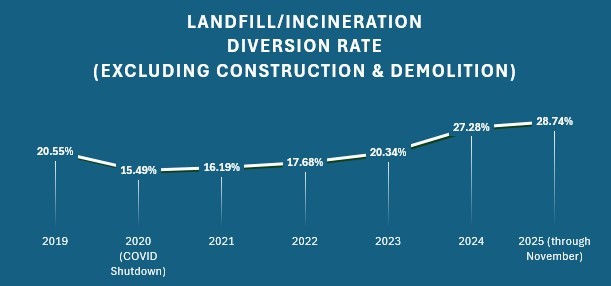
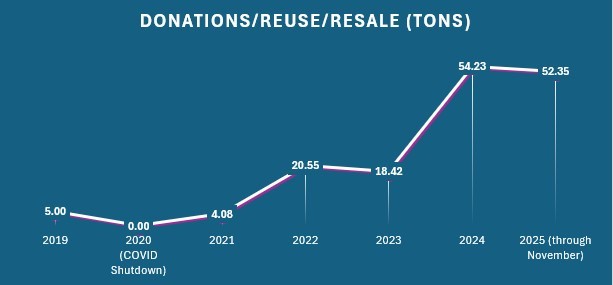
The graphs at the bottom of this page include the same timeframe but also includes year to date data for 2025.
Yearly (Jan.1 to Dec.31) Total Waste Report including Construction Debris (C&D) in pounds
| 2024 | 2023 | 2022 | 2021 | 2020 | |
| tons | tons | tons | tons | tons | |
| Total Waste Landfilled or Incinerated | 2,521 | 2,924 | 2,799 | 2,628 | 1,656 |
| Total Waste Landfilled or Incinerated (excluding Construction & Demolition) | 1,885 | 1,960 | 1,999 | 1,793 | 1,268 |
| Total Waste Recycled | 15,946 | 3,431 | 3,108 | 2,164 | 948 |
| Total Waste Recycled (excluding Construction & Demolition) | 830 | 483 | 419 | 344 | 357 |
| Total Organic Waste Diverted | 152 | 163 | 137 | 142 | 117 |
| Total Reuse/Donations | 70 | 18 | 21 | 4 | 0 |
| GRAND TOTAL | 18,688 | 6,537 | 6,065 | 4,939 | 2,721 |
| GRAND TOTAL excluding C&D | 2,936 | 2,625 | 2,575 | 2,283 | 1,742 |
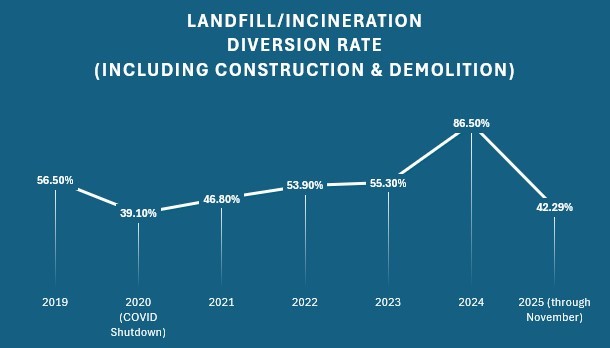
Diversion Rate (2019-2025) including construction and demolition waste


